The Unexpected Story Behind Canadian Alcohol Habits
Canadian Alcohol Habits in 2025 tell a compelling story that extends far beyond simple consumption figures. Through the lens of drinking habits, we gain remarkable insights into regional cultures, economic forces, and shifting social attitudes across the country. This comprehensive analysis examines two decades of total alcohol consumption data from Statistics Canada, revealing surprising trends and significant transformations in how Canadians approach alcoholic beverages.
As part of our series exploring Canadian Alcohol habits, this post connects the dots between provincial variations, demographic shifts, and industry responses. From the striking regional differences in per capita consumption to the nationwide premiumization trend that’s reshaping the market, these patterns offer valuable insights for consumers, industry stakeholders, and policymakers alike.
The data reveals a nation in transition – one where traditional assumptions about Canadian alcohol habits are increasingly challenged by evolving preferences and changing social norms. Let’s explore what the numbers tell us about Canada’s complex and evolving relationship with alcohol.
National Consumption Overview: How Canada Drinks
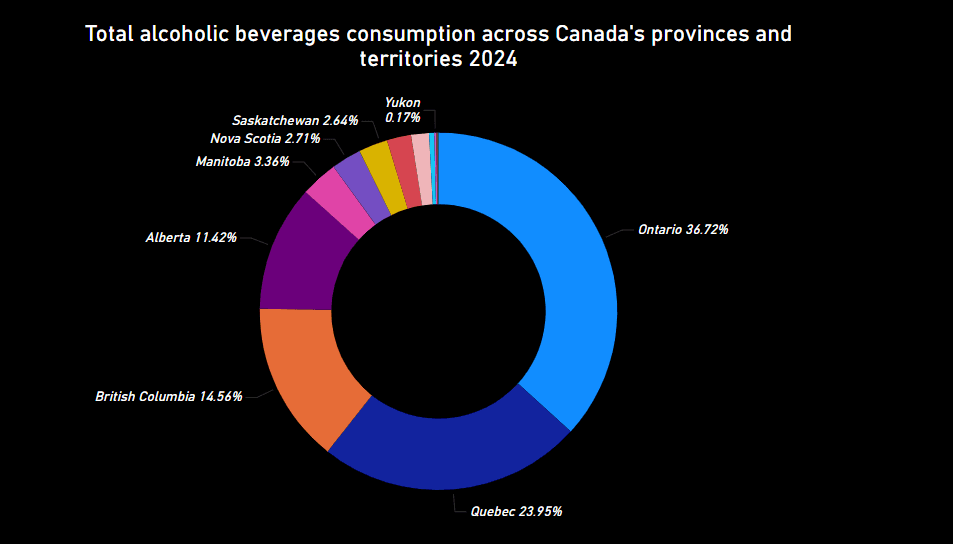
The distribution of alcohol consumption across Canada reveals a striking geographical pattern. Ontario leads the nation with 36.72% of total consumption, followed by Quebec at 23.95%, and British Columbia at 14.56%. Together, these three provinces account for over 75% of all alcoholic beverages consumed in Canada, reflecting their large populations and established drinking cultures.
This concentration in just three provinces creates a centralized market dynamic where industry trends, regulatory changes, and consumer preferences in these regions disproportionately influence the national landscape. The “Big Three” provinces function as bellwethers for the alcohol industry, with Ontario alone representing more than one-third of the entire Canadian market. This dominance shapes everything from distribution networks to marketing strategies and product development priorities. While these overall figures provide a snapshot of total consumption, they don’t tell the complete story of how preferences vary by beverage type. For instance, beer consumption patterns show distinct regional variations that don’t always align with total alcohol intake.
Alberta (11.42%) occupies a distinct fourth position, creating significant distance between itself and the remaining provinces. This aligns with Alberta’s position as the fourth most populous province but also reflects its unique privatized retail model that offers consumers greater selection and accessibility compared to many other provinces. Manitoba (3.34%) and Nova Scotia (2.71%) form the middle tier of consumption, while Saskatchewan (2.64%) follows closely behind despite having a larger population than Nova Scotia, suggesting regional cultural differences in drinking habits.
The territories present a fascinating contrast. While their absolute consumption percentages appear minimal—Yukon (0.17%), Northwest Territories (0.13%), and Nunavut (0.07%)—these figures must be contextualized against their small populations. The Yukon’s contribution is particularly noteworthy, showcasing its unique relationship with alcohol that becomes even more apparent when examining per capita figures.
This provincial distribution broadly mirrors population density but with important exceptions that become clearer when examining per capita consumption. The variations suggest complex interplays between demographics, regulatory frameworks, cultural attitudes, pricing structures, and accessibility—all factors that shape how and why Canadian alcohol habits differ across the country’s diverse regions.
Per Capita Consumption: Who Drinks More?
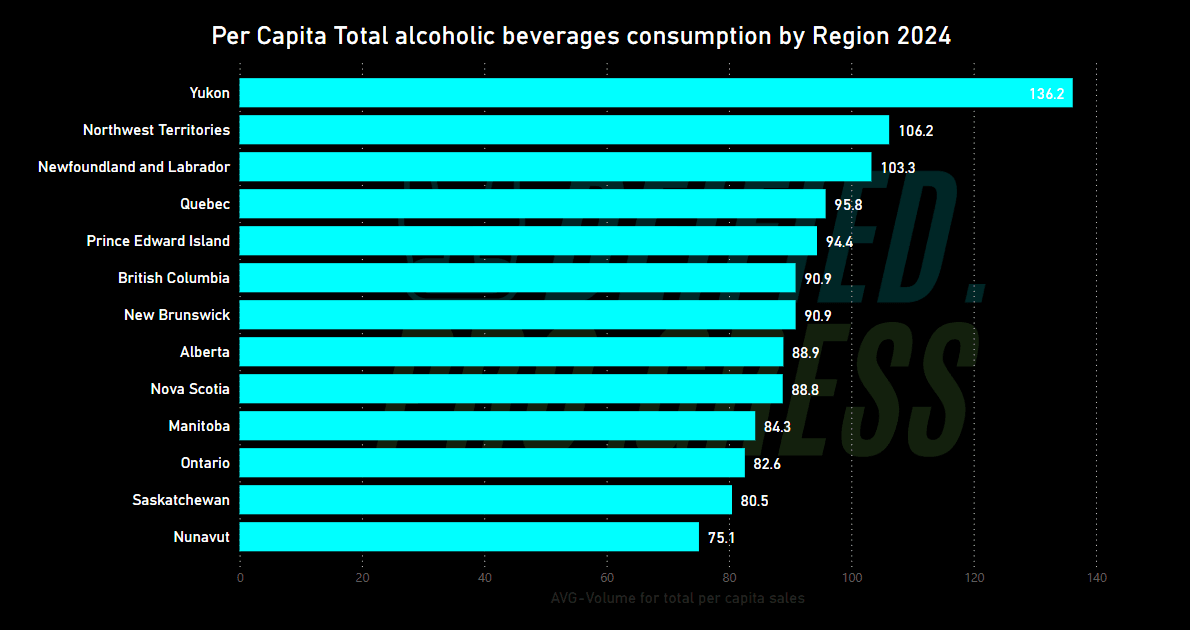
When we analyze consumption on a per-person basis, a dramatically different picture emerges. The Yukon leads the nation at 136.2 liters per capita, significantly higher than the national average. The Northwest Territories (106.2) and Newfoundland and Labrador (103.3) follow, revealing that Canada’s northern and eastern regions have the highest individual consumption rates.
Quebec ranks fourth at 95.8 liters per person, reflecting its strong wine culture and social acceptance of alcohol. Quebec’s strong showing at 95.8 liters per person aligns with its well-established wine drinking culture, which has historically influenced the province’s overall approach to alcohol consumption. Interestingly, despite Ontario’s dominance in total consumption, it ranks near the bottom at just 82.6 liters per capita, suggesting that its high overall numbers are driven primarily by population size rather than individual drinking habits.
This data challenges common perceptions about regional drinking habits and highlights the importance of population-adjusted metrics when examining consumption patterns.
Total Volume Analysis: The Provincial Powerhouses
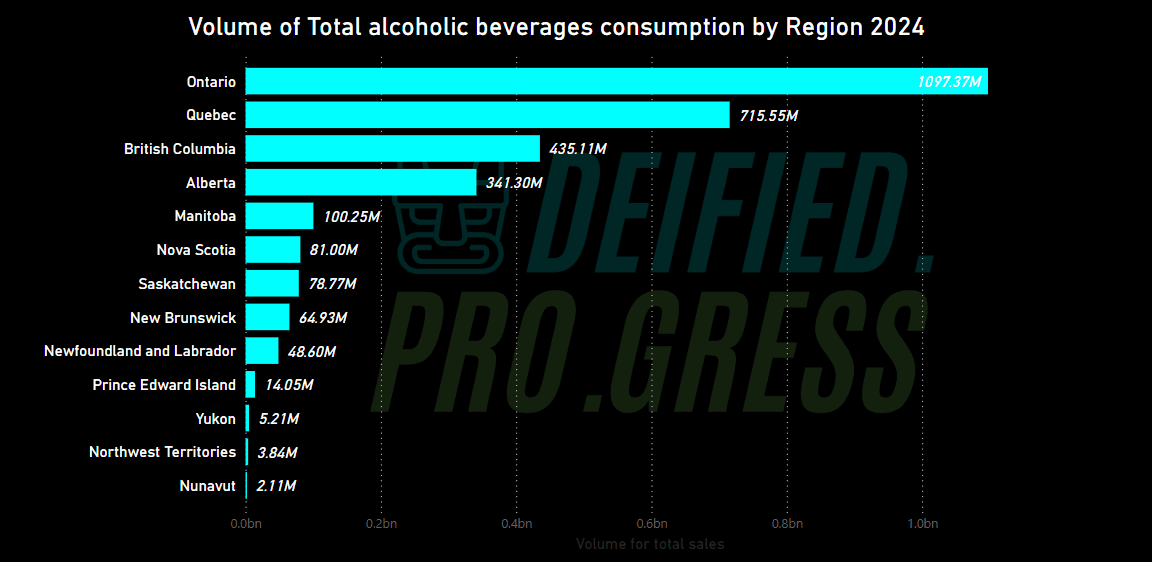
The total volume data reinforces Ontario’s dominant position, with consumption exceeding 1 billion liters (1,097.37M), substantially ahead of Quebec (715.55M) and British Columbia (435.11M). This measurement directly correlates with market size and purchasing power, making it particularly relevant for industry stakeholders.
The stark contrast between larger provinces and territories becomes evident here. Nunavut’s consumption (2.11M liters) is approximately 500 times smaller than Ontario’s, highlighting the vast differences in market scale across the country.
For alcohol producers, distributors, and retailers, these volume figures help identify primary markets where investment in distribution networks, marketing efforts, and specialized product offerings would yield the greatest returns.
Revenue Generation: Beyond Volume
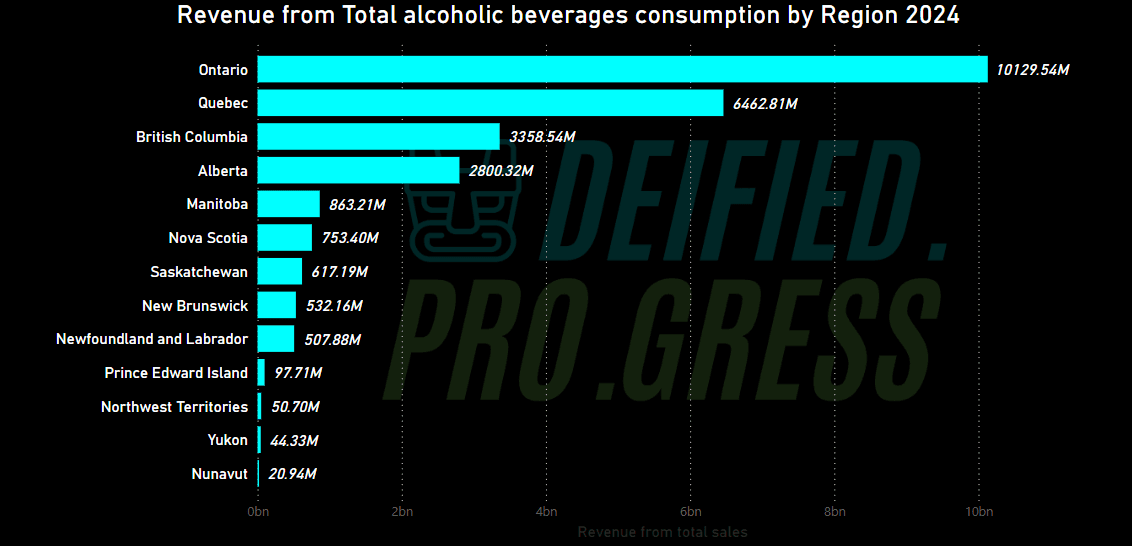
Revenue figures largely mirror volume patterns but with important distinctions. Ontario generates over $10 billion in alcohol sales (10,129.54M), followed by Quebec ($6,462.81M) and British Columbia ($3,358.54M).
The revenue-to-volume ratio varies significantly across provinces, suggesting differences in:
- Product preferences (premium vs. value options)
- Taxation structures
- Pricing strategies
- Distribution models (public vs. private)
For instance, comparing Alberta’s revenue ($2,800.32M) to its volume (341.30M liters) against other provinces indicates a higher average price per liter, potentially reflecting either consumer preference for premium products or different taxation and pricing policies.
Historical Trends: Volume vs. Revenue (2005-2024)
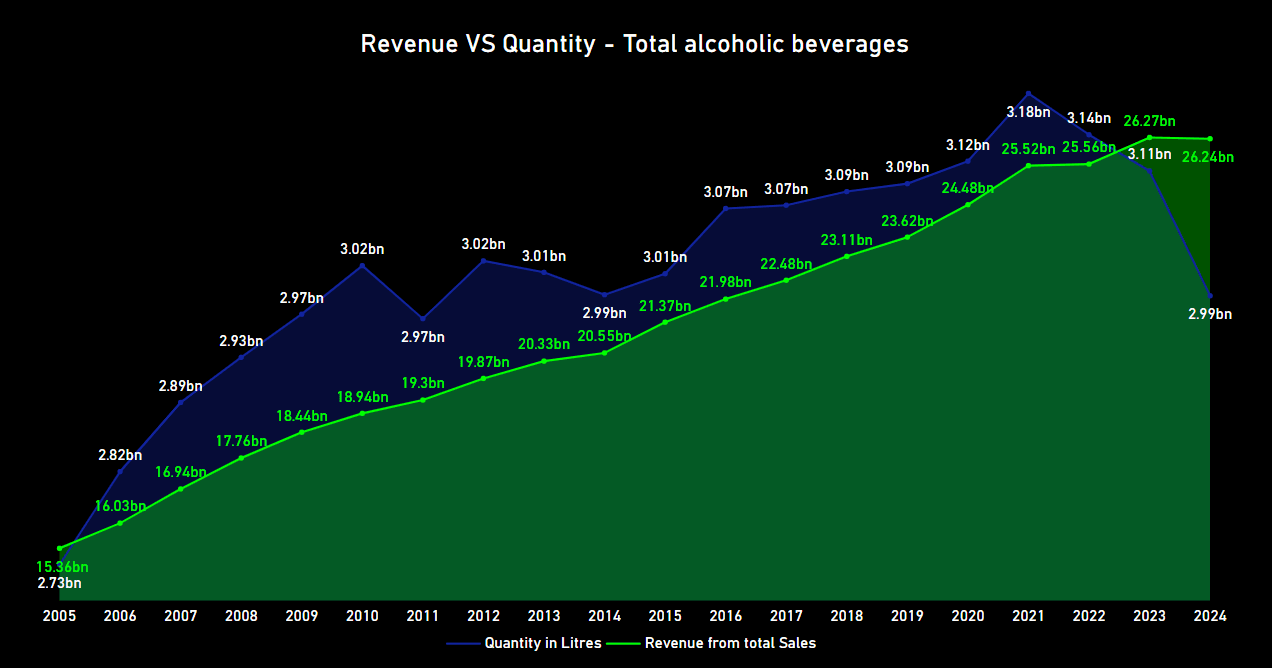
The 20-year trend reveals a fascinating divergence between consumption volume and revenue. While quantity purchased has remained relatively stable (fluctuating between 2.73 billion and 3.18 billion liters), revenue has grown steadily from $15.34 billion in 2005 to $24.24 billion in 2024.
This widening gap between volume and revenue indicates:
- A significant premiumization trend where consumers are choosing higher-quality, higher-priced beverages
- Increased taxation on alcoholic products
- Inflation and rising production costs passed on to consumers
The trend peaked in 2021-2022 before showing a decline toward 2024, potentially reflecting pandemic-related consumption patterns followed by economic pressures reducing consumer spending on premium alcohol products.
Per Capita Consumption Over Time: Changing Canadian Alcohol Habits
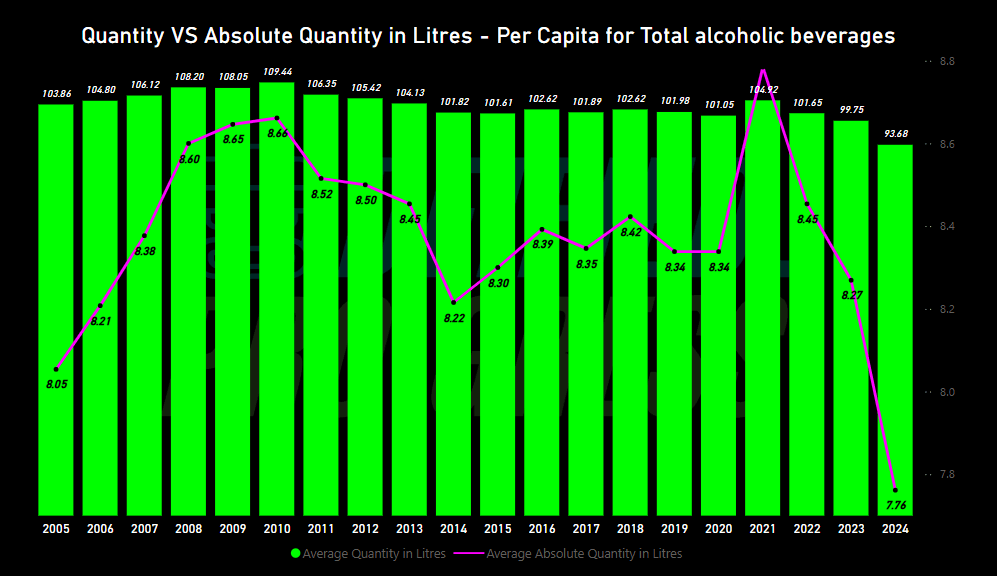
The per capita consumption data from 2005-2024 reveals subtle but important shifts in Canadian alcohol habits. Average consumption peaked around 2009-2010 at approximately 109 liters per person before beginning a gradual decline to 93.7 liters in 2024.
The absolute quantity line (purple) tracks the concentration of alcohol within beverages, showing fluctuations between 8.05 and 8.66 liters of absolute alcohol per capita. The recent downward trend suggests Canadians are not only drinking less volume but potentially choosing lower-alcohol options.
These patterns align with global health-conscious trends and may reflect:
- Growing awareness of alcohol’s health impacts
- Changing social attitudes toward heavy drinking
- The rising popularity of low/no-alcohol alternatives
- Demographic shifts as younger generations appear to drink less than their predecessors
Provincial Year-over-Year Trends: Regional Variations
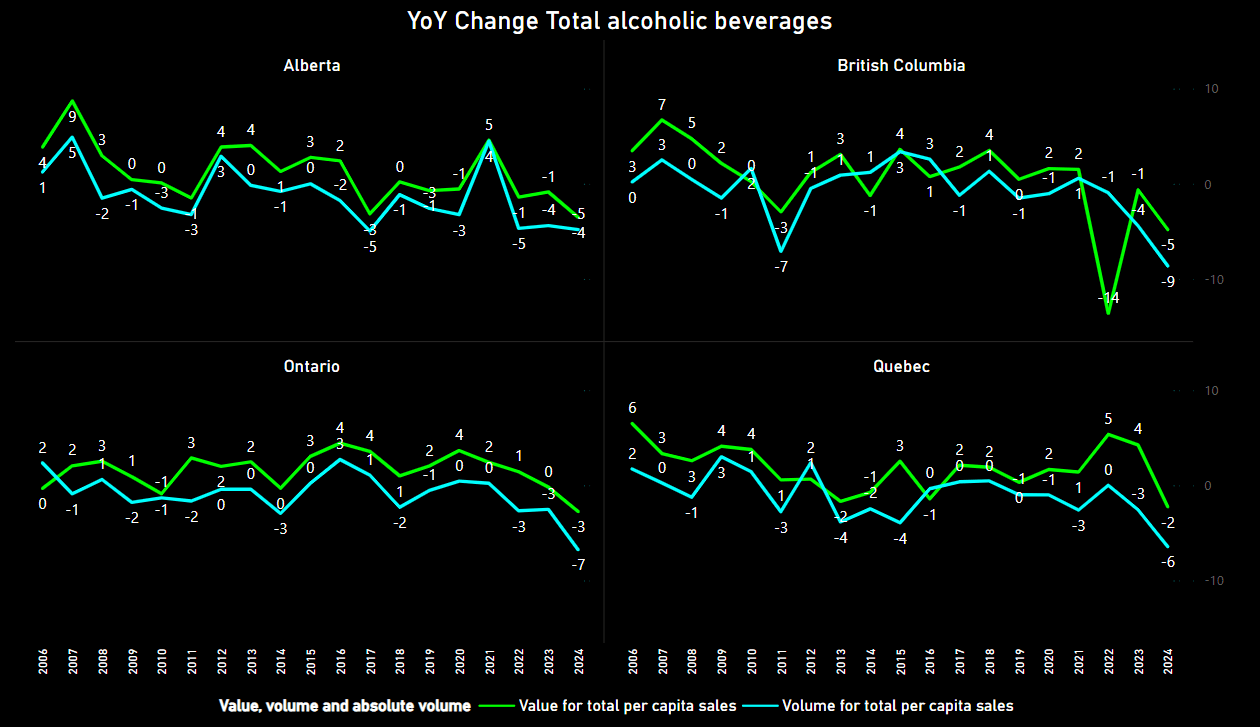
The year-over-year comparison for Alberta, British Columbia, Ontario, and Quebec reveals unique regional patterns and vulnerabilities to economic and social factors. All four provinces show significant volatility over the past two decades, with both positive and negative growth periods.
Notable observations include:
- British Columbia experienced dramatic declines in 2023 (-14% value) before moderate recovery
- Ontario shows more stability than other provinces but still recorded a -7% volume decline in 2024
- Quebec demonstrates the strongest recent growth in value (5% in 2023) despite volume declines
- Alberta shows sharp fluctuations, particularly sensitive to economic conditions within the province
These provincial differences underscore the importance of tailored regional approaches for alcohol policy, taxation, and business strategy.
These provincial differences extend to specific beverage categories as well. As explored in our analysis of spirits consumption trends, regional preferences for different spirit types create distinct consumption patterns that contribute to these broader fluctuations.
Two-Decade Perspective: The Big Picture
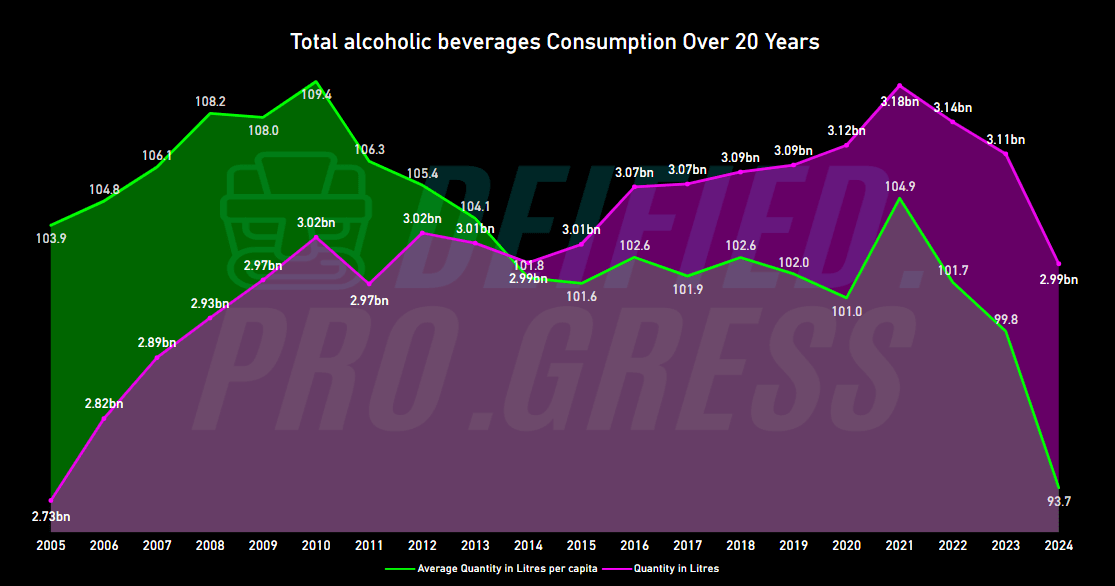
The 20-year view presents a compelling narrative of Canada’s evolving relationship with alcohol. The data shows three distinct phases:
- Growth Phase (2005-2010): Steady increases in both per capita consumption and total volume
- Plateau Phase (2010-2019): Relative stability with minor fluctuations
- Volatility Phase (2020-2024): Pandemic-influenced spike followed by sharp decline
The pandemic created unprecedented disruption, with consumption patterns first increasing dramatically during lockdowns before falling significantly as economic pressures, health concerns, and changing social habits took effect.
The current level of 93.7 liters per capita represents a return to levels not seen since before 2005, potentially signaling a fundamental shift in Canadian alcohol habits.
Year-over-Year Changes: Quantity vs. Revenue

The final visualization highlights the often inverse relationship between quantity and revenue growth rates. While quantity sold has frequently shown negative growth over the past decade, revenue has maintained positive growth in most years.
The dramatic spike in both metrics in 2021 (6.3% revenue growth, 3.8% quantity growth) represents the pandemic’s peak impact on consumption, followed by subsequent corrections. The substantial decline in quantity sold in 2024 (-6.1%) alongside a smaller revenue decline (-3.0%) reinforces the premiumization trend, where consumers purchase less but spend more per unit.
What This Means for Canadians
Health Implications
The overall downward trend in per capita consumption aligns with public health objectives. Lower consumption levels potentially translate to reduced alcohol-related health issues, including liver disease, certain cancers, and mental health concerns. However, the high per capita consumption in certain regions, particularly the territories and Newfoundland and Labrador, may warrant targeted public health interventions.
Cultural Shifts
The data suggests evolving attitudes toward alcohol across generations. The traditional “drinking culture” appears to be gradually transforming, with Canadians potentially becoming more mindful consumers. This shift mirrors international trends where quality increasingly trumps quantity, and moderation becomes more socially normalized.
This transformation isn’t uniform across all beverage categories. While traditional favorites remain popular, emerging categories like ciders and ready-to-drink beverages are experiencing growth among certain demographics, particularly younger consumers seeking alternatives to traditional options.
Regional Identity
Provincial consumption patterns reflect distinct regional identities and preferences. Quebec’s higher per capita consumption reflects its European-influenced attitudes toward regular but moderate alcohol consumption, particularly with meals. The territories’ high consumption rates may relate to unique social, cultural, and environmental factors, including limited entertainment alternatives and challenging climate conditions.
Economic Impact
For the average Canadian consumer, the premiumization trend means spending more per drink, even while consuming less overall. This shift impacts household budgets, particularly during inflationary periods, potentially driving further reductions in consumption or shifts toward home consumption versus on-premise drinking.
Implications for the Alcohol Industry
Producers and Manufacturers
For alcohol producers, the declining volume but increasing revenue scenario suggests:
- Opportunity in premium and super-premium segments
- Need for portfolio diversification, including low/no-alcohol options
- Importance of brand value propositions beyond mere consumption
- Growing importance of specialized, craft, and artisanal products
Distributors and Retailers
The distribution sector must adapt to:
- Changing inventory management with fewer units but higher value
- Regional specialization based on distinct provincial preferences
- E-commerce and direct-to-consumer models where permitted
- Experience-focused retail environments that justify premium prices
Policy and Regulation
Government agencies should consider:
- The economic impact of taxation strategies on consumption behaviors
- The economic impact of taxation strategies on consumption behaviors
- Balance between revenue generation and public health objectives
- Support for responsible innovation within the industry
Marketing and Consumer Engagement
Alcohol marketing will likely continue evolving toward:
- Experience and occasion-based messaging rather than product-focused advertising
- Sustainability and ethical production credentials
- Health-conscious positioning, including transparency about ingredients and production methods
- Cultural alignment with moderation and responsibility
Future Outlook and Predictions
Based on the trends observed, we can anticipate several developments in Canada’s alcohol landscape:
- Continued Moderation: The overall downward trajectory in per capita consumption will likely continue, though potentially at a slower rate.
- Premiumization Plateau: While the value-over-volume trend will persist, economic pressures may cause a temporary plateau in ultra-premium segments.
- Category Blurring: Traditional boundaries between beer, wine, spirits, and ready-to-drink beverages will further erode as consumers embrace cross-category innovations. Traditional boundaries between beer, wine, spirits, and ready-to-drink beverages will further erode as consumers embrace cross-category innovations.
- Regional Convergence: While significant provincial differences will remain, some gradual convergence in consumption patterns may occur through online commerce, migration patterns, and national marketing campaigns.
- Health-Conscious Alternatives: Expect substantial growth in functional beverages, alcohol-free alternatives, and products with added health benefits or reduced negative impacts.
Conclusion
Canada’s alcohol consumption landscape tells a nuanced story of evolving preferences, regional distinctions, and changing social attitudes. Far from being a simple statistical exercise, this comprehensive analysis reveals how Canadian alcohol habits reflect broader societal shifts—from health consciousness to economic pressures to cultural identity.
The overarching trend toward moderate consumption coupled with premiumization signals a fundamental transformation in the market. Canadians are increasingly choosing quality over quantity, seeking meaningful experiences rather than mere consumption. This shift represents a maturation of the Canadian alcohol market, where discernment and thoughtfulness increasingly characterize purchasing decisions.
For consumers, this evolution manifests in more diverse options, from craft beverages to low-alcohol alternatives. For industry stakeholders, it demands innovation and agility to meet changing expectations. And for policymakers, these trends necessitate balanced approaches that recognize both the economic significance of the alcohol sector and public health considerations.
Throughout our series examining Canadian alcohol habits—including our detailed analyses of wine trends, beer consumption, spirits preferences, and cider markets —we’ve uncovered how each beverage category contributes to this complex national portrait. Together, these five explorations provide a comprehensive view of how Canadians interact with alcoholic beverages across different regions, demographics, and all over past 20 years.
The coming years will likely bring continued transformation as Canada’s relationship with alcohol evolves alongside changing demographics, health priorities, and economic realities. We may see further regionalization of preferences, accelerated innovation in product development, and new approaches to responsible consumption. The pandemic’s lasting impact on purchasing and consumption patterns will continue to reshape the industry, potentially accelerating trends that were already emerging.
For industry participants, adaptability and consumer-centricity will remain essential for navigating this dynamic landscape. Understanding the nuances of Canadian alcohol habits—from regional variations to generational differences—will separate successful brands from those that fail to evolve. As premium segments continue to grow despite overall volume declines, creating meaningful brand experiences and authentic connections with consumers will become increasingly vital.
As we continued to monitor and analyze these trends in our series, one thing remains clear: Canada’s relationship with alcohol serves as a revealing lens through which we can observe broader social, economic, and cultural patterns. By understanding these patterns, we gain insight not just into what Canadians drink, but into how Canadian society itself is changing.
- How Much Wine Are Canadians Drinking in 2025?
- How Much Cider Are Canadians Drinking in 2025?
- How Much Spirit Are Canadians Drinking in 2025?
- How Much Beer Are Canadians Drinking in 2025?
Sources
Statistics Canada. Table 10-10-0010-01 Sales of alcoholic beverages types by liquor authorities and other retail outlets, by value, volume, and absolute volume


