Elevating Strategic Analysis in Economics with Data Science: A Practical Guide
As a data scientist with a decade of experience spanning data science, visualization, and engineering within the Canadian public sector, I’ve witnessed firsthand the transformative power of data. Applying these tools to strategic analysis in economics is no longer a novelty; it’s becoming essential for robust, evidence-based decision-making. This guide breaks down how data science fundamentally enhances economic strategy development and implementation. The core principle of strategic analysis in economics involves understanding complex economic systems, predicting future trends, evaluating policy impacts, and making informed decisions to achieve specific economic goals. Data science provides the advanced analytical toolkit to perform these tasks with unprecedented accuracy and depth.
Why Integrate Data Science into Strategic Analysis in Economics?
Traditional economic analysis often relies on established theoretical models and limited datasets. Data science complements and extends these methods by:
- Handling Complexity and Scale: Processing vast, diverse datasets (Big Data) that were previously unmanageable.
- Identifying Hidden Patterns: Uncovering subtle correlations and trends invisible to conventional analysis.
- Improving Predictive Accuracy: Building more sophisticated forecasting models for economic indicators, market behaviour, or policy outcomes.
- Enabling Granular Insights: Analyzing economic phenomena at micro-levels (e.g., individual firms, households, specific regions).
- Quantifying Uncertainty: Providing better measures of risk and confidence intervals around predictions and assessments.
Core Data Science Techniques for Strategic Analysis in Economics
Integrating data science isn’t about replacing economists but empowering strategic analysis in economics with more powerful tools. Here are key techniques:
1. Predictive Modeling & Forecasting
- What it is: Using statistical algorithms and machine learning to predict future outcomes based on historical data. Techniques include time series analysis (ARIMA, Prophet), regression models, and machine learning forecasters (like Random Forests or Gradient Boosting).
- Application: Forecasting GDP growth, inflation rates, or shifts in major consumer spending categories like future food costs or transportation trends, unemployment levels, tax revenues, or the demand for public services. Essential for budget planning and proactive policy design.
2. Machine Learning for Pattern Recognition
- What it is: Algorithms that learn from data to identify patterns, classify information, or make decisions with minimal human intervention. Includes clustering, classification, and association rule mining.
- Application: Segmenting industries based on risk profiles, identifying factors driving regional economic disparities, detecting fraudulent activities in economic transactions, or understanding consumer behavior shifts.
3. Natural Language Processing (NLP)
- What it is: Enabling computers to understand, interpret, and generate human language.
- Application: Analyzing sentiment in news articles or social media to gauge public economic confidence, extracting key information from policy documents or reports, and understanding narratives around economic events.
4. Causal Inference Methods
- What it is: Statistical techniques aiming to determine cause-and-effect relationships from observational data (where randomized control trials are infeasible). Methods include difference-in-differences, regression discontinuity, and instrumental variables.
- Application: Evaluating the true impact of a policy intervention (e.g., a tax credit, a training program) on economic outcomes like employment or business investment, crucial for strategic analysis in economics.
5. Data Visualization and Communication
- What it is: Creating visual representations of data and insights (charts, dashboards, maps) to facilitate understanding and communication.
- Application: Presenting complex economic trends and analysis results to policymakers and the public in an accessible way. Interactive dashboards allow exploration of different scenarios.
Implementing Data-Driven Strategic Analysis in Economics: 7 Step Framework
Successfully applying these techniques requires a structured approach:
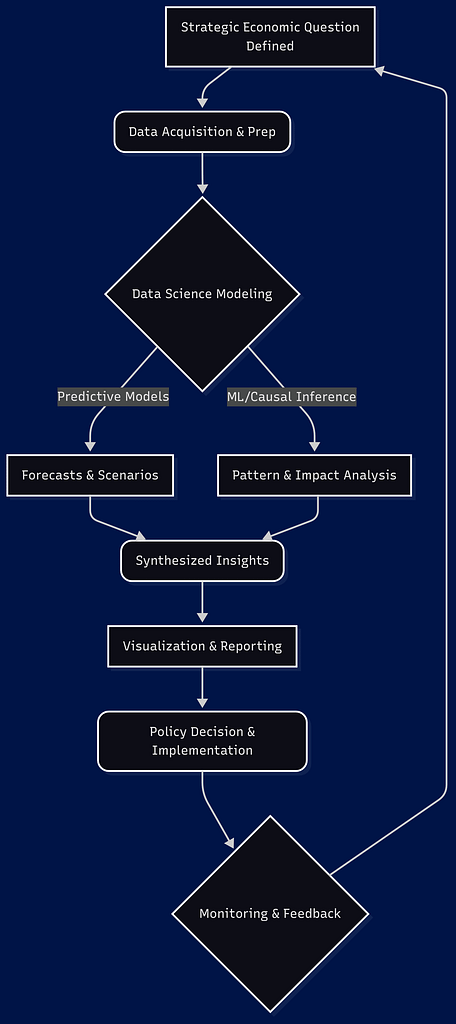
- Define the Strategic Question: Clearly articulate the economic problem or policy question (e.g., “How will a carbon tax impact regional employment?”).
- Identify & Acquire Data: Source relevant, reliable data (e.g., StatCan datasets, administrative data, open data portals, surveys). Address data quality, privacy, and linkage challenges.
- Data Preparation & Exploration: Clean, transform, and explore the data to understand its structure, limitations, and potential biases.
- Model Selection & Application: Choose and apply appropriate data science techniques based on the question and data type. This involves experimentation and validation.
- Insight Generation & Validation: Interpret model outputs, validate findings against economic theory and domain expertise, and quantify uncertainty.
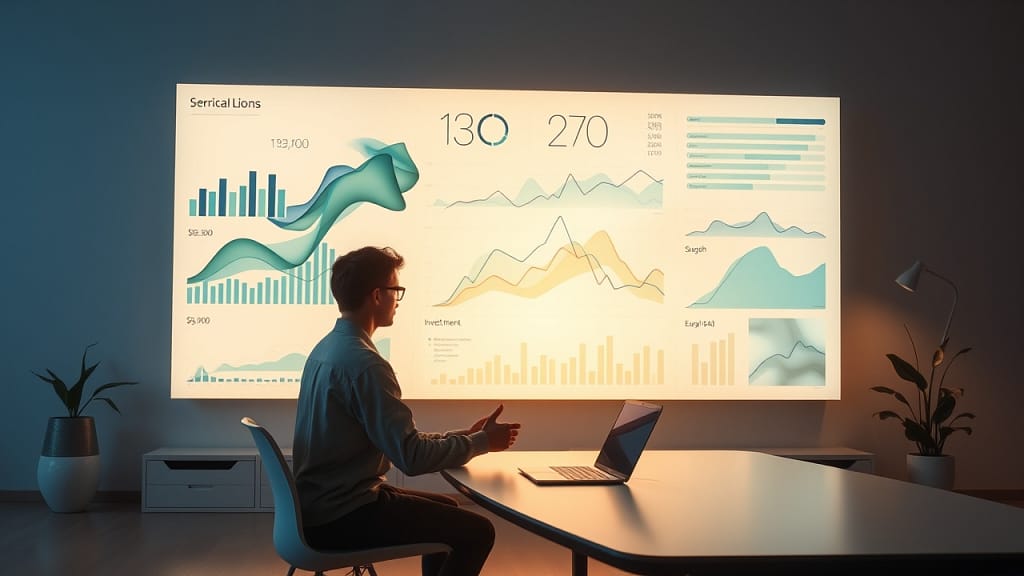
- Visualization & Communication: Translate complex findings into clear, actionable insights using effective visualizations and narratives. (See Visualization Example below)
- Policy Integration & Monitoring: Integrate insights into the strategic decision-making process and establish mechanisms to monitor outcomes and update analyses.

(This diagram illustrates how raw data, processed through various data science techniques, yields insights that inform strategic economic decisions, with a feedback loop for continuous improvement.)
Challenges in Applying Data Science to Strategic Analysis in Economics
While powerful, this integration faces hurdles:
- Data Availability & Quality: Accessing granular, timely, and clean data can be difficult, especially in the public sector.
- Privacy & Ethics: Handling sensitive economic and personal data requires strict adherence to privacy regulations and ethical guidelines.
- Skills Gap: Need for professionals skilled in both economics and data science (or effective collaboration between teams).
- Model Interpretability: Complex “black box” models can be hard to explain to non-technical stakeholders, hindering trust and adoption.
- Correlation vs. Causation: Ensuring analyses correctly identify causal impacts rather than mere correlations is critical for effective policy.
The Future: AI and Enhanced Strategic Analysis in Economics
The field is rapidly evolving. Expect greater use of AI for more sophisticated analysis, real-time data streams informing immediate policy adjustments, and an increased focus on ethical AI frameworks within economic policy development. Continuous learning and adaptation are key for practitioners.
Conclusion: Embracing Data for Smarter Economic Strategy
Leveraging data science offers a significant upgrade to strategic analysis in economics. By enabling deeper insights, more accurate forecasts, and rigorous policy evaluation, it empowers economists and policymakers—particularly in the public sector—to navigate complexity and make more effective, evidence-based decisions. While challenges exist, the benefits of a data-informed approach to economic strategy are undeniable and increasingly crucial.
Frequently Asked Questions (FAQ)
What specific data sources are useful for strategic analysis in economics in Canada?
A: Key sources include Statistics Canada (e.g., Labour Force Survey, GDP data, CPI), administrative data from government departments (e.g., tax records, program usage data, with appropriate privacy safeguards), Bank of Canada data, provincial/territorial statistics agencies, and specialized surveys or open data portals.
Do I need to be an expert economist and a data scientist?
A: While multi-disciplinary skills are valuable, effective collaboration between economists (providing domain expertise and theoretical grounding) and data scientists (providing technical skills) is often the most practical and effective approach. Strong communication is vital.
What are some common software tools used?
A: Common tools include programming languages like Python (with libraries like Pandas, Scikit-learn, Statsmodels, TensorFlow) and R (with its vast statistical packages), database tools (SQL), and visualization platforms (like Tableau, Power BI, or Python/R plotting libraries).
How can we ensure ethical use of data science in economic policy?
A: This requires robust data governance frameworks, strict adherence to privacy laws (like PIPEDA), transparency in methods (where possible), bias audits in algorithms, and a focus on fairness and equity in outcomes. Public consultation and ethical reviews are also important components.


